
Real Estate Dashboard
Overview
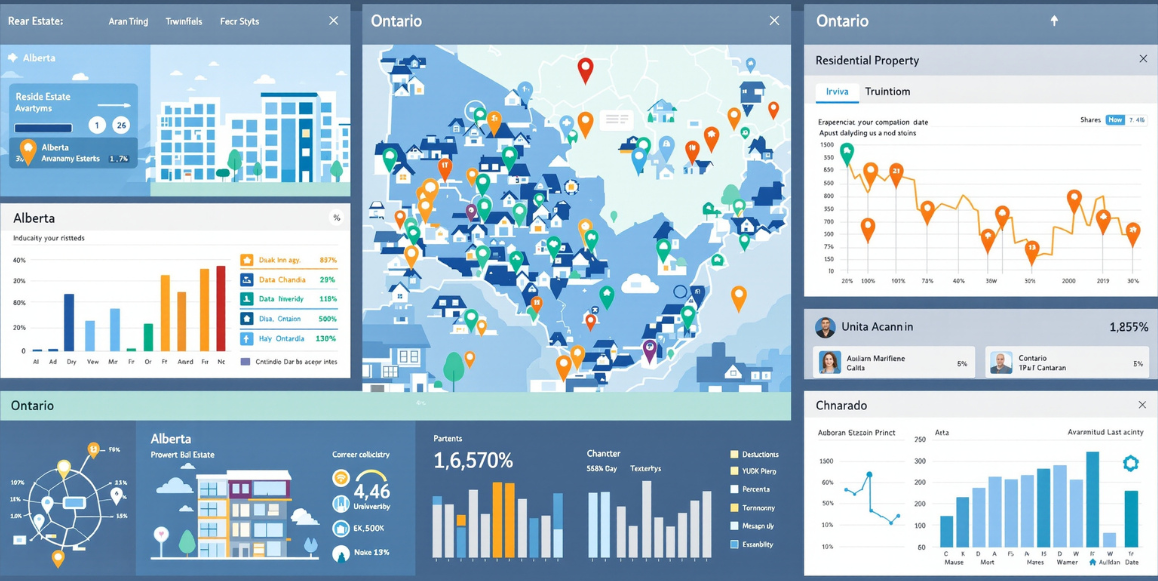
The Real Estate Market Dashboard offers a strategic and interactive overview of the residential housing landscape across Alberta and Ontario, utilizing real-time listing data and geographic market trends. Developed in Power BI, this dashboard enables stakeholders — including property buyers, sellers, brokers, investors, and market analysts — to derive actionable insights from complex real estate datasets.
Tool Used
PowerBI, Excel
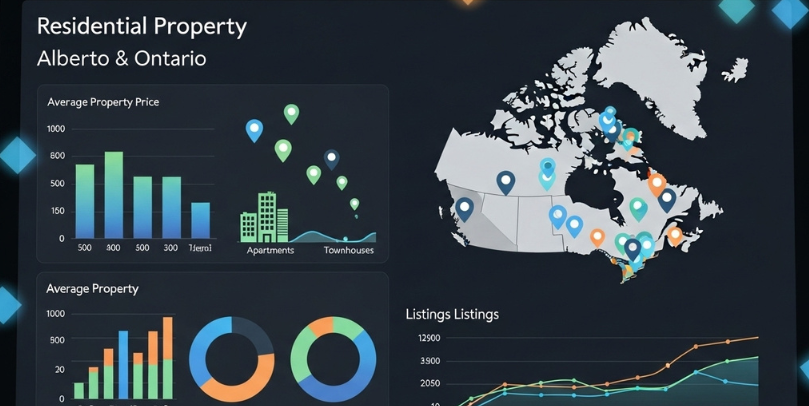
At its core, the dashboard integrates and analyzes over 24,000 property listings from two provinces, focusing on key real estate indicators such as listing prices, property sizes (area), number of bedrooms, and broker activity. The data was extracted from raw CSV files, cleaned extensively, and modeled into a unified format to ensure consistency and comparability.
This top-level view helps users identify provincial dominance in listings, analyze pricing behavior, and explore how various cities differ in property size and value. For example, initial observations suggest that Ontario holds the majority of listings, while Alberta properties typically offer larger spaces.
Overall, this Executive Summary acts as the gateway to deeper pages of analysis — setting the stage for users to navigate into city-level trends, broker performance, and property-type breakdowns, all of which support strategic decision making in the real estate market.